TiDB 学习课程 Lesson-2

这一节,我们需要对一个完整的 TiDB 集群进行性能测试,为了实现这一目标,本文会通过以下几个步骤来介绍如何从零开始实现 TiDB 的性能测试:

  1. 借助 kind 在单机模拟集群
  2. 通过 TiDB Operator 部署 TiDB 集群到 K8S
  3. 根据机器硬件调整 TiDB 配置
  4. 性能测试
    1. sysbench 测试
    2. go-ycsb 测试
    3. go-tpc 测试
  5. 性能瓶颈分析

借助 kind 在单机模拟集群

kind 能通过容器技术来模拟 K8S 集群:在 docker 容器中运行 K8S Node,再在 Node 中创建容器环境,并管理 Pod,名副其实的 docker in docker。

安装 kind

首先,我们需要在本地安装 kind (这里忽略了 docker 的安装步骤,想要安装 docker 可以参见其安装文档):

1
brew install kind

brew 安装的 kind 版本是 v0.8.1,如果想体验最新特性,可以从 kind 的 github 仓库获取最新代码并通过 go 编译后安装。

kind 本身并不依赖 kubectl,但为了方便,我们也一并将之安装:

1
brew install kubectl

kind 安装好之后,我们就可以着手创建我们的 K8S 集群了。

构建 K8S

我们知道,任意一个 K8S Node,都至少需要一个 kubelet 和一个 docker env ,对于需要用作 control panel 的 node,还需要安装 apiserveretcdschedulercontroller-manager等等组件,通常我们会使用kubeadm工具来安装。

不过 kind 作为将 docker 容器用作 node 的技术,其本身已经提供了完整的 node 镜像:node-image,并且我们只需要配置其 cluster 描述文件,即可快速创建出我们想要的集群。

以下根据是官方提供的基准 kind 配置文件进行修改后用来部署 TiDB 集群的 yaml 配置,其内容借鉴了 TiDB Operator 的 kind 集群初始化脚本(文件名 one-control-three-worker-kind-cluster.yaml):

1
2
3
4
5
6
7
8
9
10
11
12
13
14
15
16
17
18
19
20
21
22
23
24
25
26
27
28
29
30
31
32
33
34
35
36
37
38
39
40
41
42
43
44
45
46
47
48
49
50
51
52
53
54
55
56
57
58
59
60
61
62
63
64
65
66
67
68
69
70
71
72
73
74
75
76
77
78
79
80
81
82
83
84
85
86
87
88
89
90
# this config file contains all config fields with comments
# NOTE: this is not a particularly useful config file
kind: Cluster
apiVersion: kind.x-k8s.io/v1alpha4
# patch the generated kubeadm config with some extra settings
kubeadmConfigPatches:
- |
apiVersion: kubelet.config.k8s.io/v1beta1
kind: KubeletConfiguration
evictionHard:
nodefs.available: "0%"
# patch it further using a JSON 6902 patch
kubeadmConfigPatchesJSON6902:
- group: kubeadm.k8s.io
version: v1beta2
kind: ClusterConfiguration
patch: |
- op: add
path: /apiServer/certSANs/-
value: my-hostname
# 1 control plane node and 3 workers
nodes:
# the control plane node config
- role: control-plane
extraPortMappings:
- containerPort: 5000
hostPort: 5000
listenAddress: 127.0.0.1
protocol: TCP
# the three workers
- role: worker
extraMounts:
- containerPath: /mnt/disks/vol_1
hostPath: <...>/worker_0/vol_1
- containerPath: /mnt/disks/vol_2
hostPath: <...>/worker_0/vol_2
- containerPath: /mnt/disks/vol_3
hostPath: <...>/worker_0/vol_3
- containerPath: /mnt/disks/vol_4
hostPath: <...>/worker_0/vol_4
- containerPath: /mnt/disks/vol_5
hostPath: <...>/worker_0/vol_5
- containerPath: /mnt/disks/vol_6
hostPath: <...>/worker_0/vol_6
- containerPath: /mnt/disks/vol_7
hostPath: <...>/worker_0/vol_7
- containerPath: /mnt/disks/vol_8
hostPath: <...>/worker_0/vol_8
- containerPath: /mnt/disks/vol_9
hostPath: <...>/worker_0/vol_9
- role: worker
extraMounts:
- containerPath: /mnt/disks/vol_1
hostPath: <...>/worker_1/vol_1
- containerPath: /mnt/disks/vol_2
hostPath: <...>/worker_1/vol_2
- containerPath: /mnt/disks/vol_3
hostPath: <...>/worker_1/vol_3
- containerPath: /mnt/disks/vol_4
hostPath: <...>/worker_1/vol_4
- containerPath: /mnt/disks/vol_5
hostPath: <...>/worker_1/vol_5
- containerPath: /mnt/disks/vol_6
hostPath: <...>/worker_1/vol_6
- containerPath: /mnt/disks/vol_7
hostPath: <...>/worker_1/vol_7
- containerPath: /mnt/disks/vol_8
hostPath: <...>/worker_1/vol_8
- containerPath: /mnt/disks/vol_9
hostPath: <...>/worker_1/vol_9
- role: worker
extraMounts:
- containerPath: /mnt/disks/vol_1
hostPath: <...>/worker_2/vol_1
- containerPath: /mnt/disks/vol_2
hostPath: <...>/worker_2/vol_2
- containerPath: /mnt/disks/vol_3
hostPath: <...>/worker_2/vol_3
- containerPath: /mnt/disks/vol_4
hostPath: <...>/worker_2/vol_4
- containerPath: /mnt/disks/vol_5
hostPath: <...>/worker_2/vol_5
- containerPath: /mnt/disks/vol_6
hostPath: <...>/worker_2/vol_6
- containerPath: /mnt/disks/vol_7
hostPath: <...>/worker_2/vol_7
- containerPath: /mnt/disks/vol_8
hostPath: <...>/worker_2/vol_8
- containerPath: /mnt/disks/vol_9
hostPath: <...>/worker_2/vol_9

执行以下命令创建我们的 K8S 集群:

1
kind create cluster --config one-control-three-worker-kind-cluster.yaml

完成后,就可以通过 kubectl cluster-info 来查看集群状态了,执行结果:

1
2
Kubernetes master is running at https://127.0.0.1:59370
KubeDNS is running at https://127.0.0.1:59370/api/v1/namespaces/kube-system/services/kube-dns:dns/proxy

再来执行 kubectl get nodes 看一看 node 状态:

1
2
3
4
kind-control-plane   Ready    master   3m45s   v1.18.2
kind-worker Ready <none> 3m5s v1.18.2
kind-worker2 Ready <none> 3m6s v1.18.2
kind-worker3 Ready <none> 3m5s v1.18.2

到此为止,我们的 K8S 集群就创建完毕了。

通过 TiDB Operator 部署 TiDB 集群到 K8S

本节内容主要参考 TiDB In Action 第二章 1.2.2 节Kubernetes 上使用 TiDB Operator 快速上手

环境准备

TiDB Operator 主要是采用 Helm 来安装的,因此我们需要先有一个 Helm:

1
brew install helm

通过 helm version 来检查 Helm 的版本,我们可以得知 brew 安装的是 Helm v3.3.0:(在 TiDB In Action 中使用的是 Helm 2,Helm 2 区分为 Client 端与 Server 端,Helm 3 不再区分,故 helm version 的输出略有不同)

1
version.BuildInfo{Version:"v3.3.0", GitCommit:"8a4aeec08d67a7b84472007529e8097ec3742105", GitTreeState:"dirty", GoVersion:"go1.14.6"}

之后配置 Helm 的 repo 与 TiDB 提供的 repo:

1
2
3
4
5
> helm repo add stable https://kubernetes-charts.storage.googleapis.com/
"stable" has been added to your repositories

> helm repo add pingcap https://charts.pingcap.org/
"pingcap" has been added to your repositories

安装 TiDB Operator 到集群

接下来为 TiDB 创建一个 namespace:

1
2
> kubectl create namespace tidb-admin
namespace/tidb-admin created

万事俱备,现在可以正式开始安装 TiDB Operator 到我们的 K8S 集群了:

1
2
3
4
5
6
7
8
9
10
11
> helm install --namespace tidb-admin tidb-operator pingcap/tidb-operator --version v1.1.3
NAME: tidb-operator
LAST DEPLOYED: Thu Aug 20 22:11:51 2020
NAMESPACE: tidb-admin
STATUS: deployed
REVISION: 1
TEST SUITE: None
NOTES:
Make sure tidb-operator components are running:

kubectl get pods --namespace tidb-admin -l app.kubernetes.io/instance=tidb-operator

如同上述输出所要求的,我们来查看一下 pod 信息:

1
2
3
4
> kubectl get pods --namespace tidb-admin -l app.kubernetes.io/instance=tidb-operator
NAME READY STATUS RESTARTS AGE
tidb-controller-manager-588848b7b6-mr9cv 1/1 Running 0 67s
tidb-scheduler-764cfb57d9-97tvx 2/2 Running 0 67s

使用 TiDB Operator 安装 TiDB 集群

*注意: Kubernetes 上使用 TiDB Operator 快速上手 中是通过 tidb-cluster.yaml 描述文件直接创建集群的,默认的 basic 示例只会创建 1 tidb + 1 tikv + 1pd,并不符合我们做性能测试的要求,因此我们仍旧使用 helm 来安装集群。

首先,我们需要安装 TiDB CRD,里面有一些自定义 K8S 对象,会在接下来的 chart 中用到:

1
2
> kubectl apply -f https://raw.githubusercontent.com/pingcap/tidb-operator/master/manifests/crd.yaml
Unable to connect to the server: dial tcp: lookup raw.githubusercontent.com on 192.168.0.1:53: read udp 192.168.0.111:60181->192.168.0.1:53: i/o timeout

可以看到,在我的机器上,上述命令会 timeout,怀疑可能是 crd.yaml 文件本身较大(703 KB),由于一些奇妙的原因,导致了timeout,解决的办法是提前下载下来,再进行安装即可:

1
2
3
4
5
6
7
8
9
10
11
12
13
14
15
16
17
18
19
20
21
22
# 下载 CRD 到本地
> curl -o crd.yaml https://raw.githubusercontent.com/pingcap/tidb-operator/master/manifests/crd.yaml
% Total % Received % Xferd Average Speed Time Time Time Current
Dload Upload Total Spent Left Speed
100 703k 100 703k 0 0 439k 0 0:00:01 0:00:01 --:--:-- 439k

# 安装
> kubectl apply -f crd.yaml
customresourcedefinition.apiextensions.k8s.io/tidbclusters.pingcap.com created
customresourcedefinition.apiextensions.k8s.io/backups.pingcap.com created
customresourcedefinition.apiextensions.k8s.io/restores.pingcap.com created
customresourcedefinition.apiextensions.k8s.io/backupschedules.pingcap.com created
customresourcedefinition.apiextensions.k8s.io/tidbmonitors.pingcap.com created
customresourcedefinition.apiextensions.k8s.io/tidbinitializers.pingcap.com created
customresourcedefinition.apiextensions.k8s.io/tidbclusterautoscalers.pingcap.com created
customresourcedefinition.apiextensions.k8s.io/tidbgroups.pingcap.com created
customresourcedefinition.apiextensions.k8s.io/tikvgroups.pingcap.com created

# 查看 tidbclusters
> kubectl get crd tidbclusters.pingcap.com
NAME CREATED AT
tidbclusters.pingcap.com 2020-08-20T15:08:03Z

安装完 CRD,还要以同样的方式安装local-volume-provisioner.yaml,否则在部署 pd 时 pod 会pending,提示找不到 StorageClass,(由于我并没有使用TiDB Operator 的 kind 集群初始化脚本,而是自建 kind cluster,所以并没有留意要执行这一步,问题搞了好久坑惨我了... )。

两个 yaml 全部搞定后,就可以开始部署集群了。

先找找最新的 chart:

1
2
3
4
5
6
7
8
9
> helm search repo pingcap
NAME CHART VERSION APP VERSION DESCRIPTION
pingcap/tidb-backup v1.1.3 A Helm chart for TiDB Backup or Restore
pingcap/tidb-cluster v1.1.3 A Helm chart for TiDB Cluster
pingcap/tidb-drainer v1.1.3 A Helm chart for TiDB Binlog drainer.
pingcap/tidb-lightning latest A Helm chart for TiDB Lightning
pingcap/tidb-operator v1.1.3 tidb-operator Helm chart for Kubernetes
pingcap/tikv-importer v1.1.3 A Helm chart for TiKV Importer
pingcap/tikv-operator v0.1.0 v0.1.0 A Helm chart for Kubernetes

我们需要安装的正是 pingcap/tidb-cluster

1
2
3
4
5
6
7
8
9
10
11
12
13
14
15
16
17
18
19
20
21
22
23
24
25
26
27
28
29
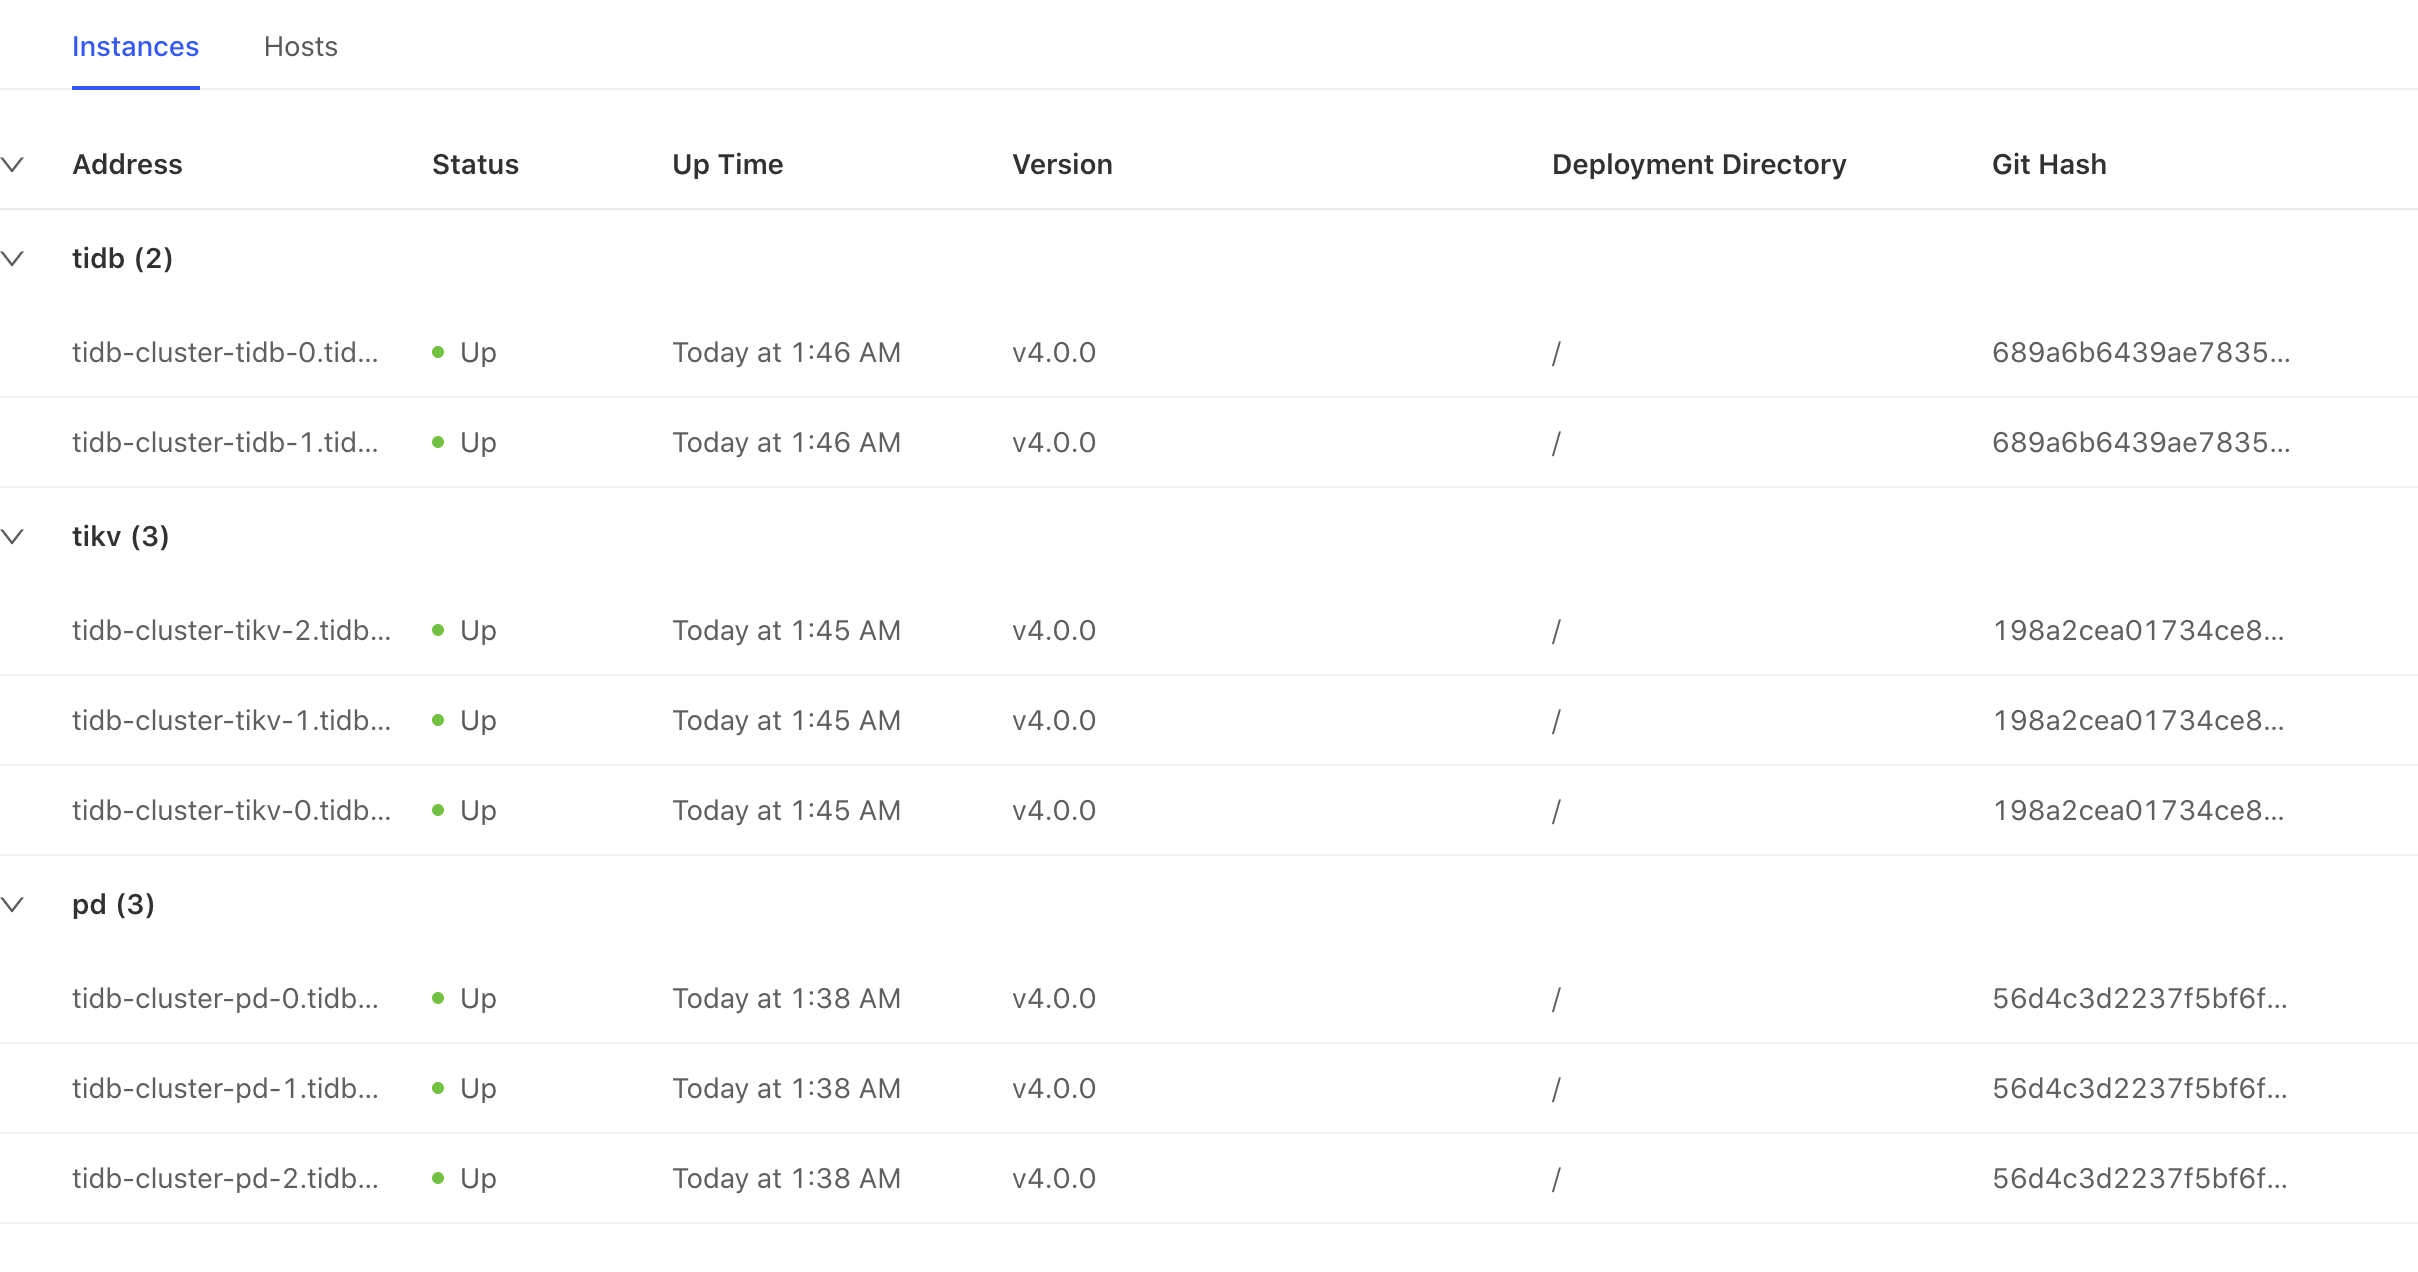
# 创建一个 namespace:tidb-cluster
> kubectl create namespace tidb-cluster
namespace/tidb-cluster created

# 用 helm 安装
> helm install --namespace tidb-cluster tidb-cluster pingcap/tidb-cluster --version v1.1.3
NAME: tidb-cluster
LAST DEPLOYED: Thu Aug 20 23:16:07 2020
NAMESPACE: tidb-cluster
STATUS: deployed
REVISION: 1
TEST SUITE: None
NOTES:
Cluster Startup
1. Watch tidb-cluster up and running
watch kubectl get pods --namespace tidb-cluster -l app.kubernetes.io/instance=tidb-cluster -o wide
2. List services in the tidb-cluster
kubectl get services --namespace tidb-cluster -l app.kubernetes.io/instance=tidb-cluster

Cluster access
* Access tidb-cluster using the MySQL client
kubectl port-forward -n tidb-cluster svc/tidb-cluster-tidb 4000:4000 &
mysql -h 127.0.0.1 -P 4000 -u root -D test
Set a password for your user
SET PASSWORD FOR 'root'@'%' = '3l4hWfGDpQ'; FLUSH PRIVILEGES;
* View monitor dashboard for TiDB cluster
kubectl port-forward -n tidb-cluster svc/tidb-cluster-grafana 3000:3000
Open browser at http://localhost:3000. The default username and password is admin/admin.
If you are running this from a remote machine, you must specify the server's external IP address.

执行watch kubectl get pods --namespace tidb-cluster -l app.kubernetes.io/instance=tidb-cluster -o wide,等待大约 10min 时间,就可以看到如下输出了:

1
2
3
4
5
6
7
8
9
10
11
NAME                                      READY   STATUS    RESTARTS   AGE
tidb-cluster-discovery-7d684bcbb6-2f2rp 1/1 Running 0 9m30s
tidb-cluster-monitor-6b978c6bd6-j7rrm 3/3 Running 0 9m35s
tidb-cluster-pd-0 1/1 Running 0 9m34s
tidb-cluster-pd-1 1/1 Running 0 9m34s
tidb-cluster-pd-2 1/1 Running 0 9m34s
tidb-cluster-tidb-0 2/2 Running 0 75s
tidb-cluster-tidb-1 2/2 Running 0 75s
tidb-cluster-tikv-0 1/1 Running 0 8m21s
tidb-cluster-tikv-1 1/1 Running 0 8m21s
tidb-cluster-tikv-2 1/1 Running 0 8m21s

我们来通过 TiDB Dashboard 来访问一下:

1
2
3
4
# 需要先通过 port-forward 来做内外端口映射
> kubectl port-forward svc/tidb-cluster-pd 2379:2379 --namespace=tidb-cluster
Forwarding from 127.0.0.1:2379 -> 2379
Forwarding from [::1]:2379 -> 2379

之后浏览器进入http://127.0.0.1:2379/dashboard/#/cluster_info/instance 来查看一下实例状态:

可以看到一切都运行正常了。

根据机器硬件调整 TiDB 配置

前文中,我们按照 TiDB Operator 的默认配置,部署了完整的 TiDB cluster。然而,由于是单机环境,测试用的 Mac 机器的是 6C + 16GB 的配置,与推荐配置相比实在过于简陋,因此我们需要把非必要的功能减去来释放额外的资源,好钢用在刀刃上。

因此,还是选择 1tidb + 1pd + 3 tikv 的最小集群,并对相关细节配置进行优化。结合 配置集群TiKV 线程池优化 中的建议,我们最终可以给出如下的集群配置(由于 values.yaml 文件内容非常多,因此以下只给出与默认配置不同的配置):

1
2
3
4
5
6
7
8
9
10
11
12
13
14
15
16
17
pd:
replicas: 1

tidb:
replicas: 2

config: |
log-level = "info"

[server]
grpc-concurrency = 2

[rocksdb]
max-background-jobs = 4

[raftdb]
max-background-jobs = 4

性能测试

以下性能测试,全部都在如下硬件配置的 K8S 集群中完成:

CPU MEM HD Deployed Items
8C vCPU 8GB 120GB SSD 1pd + 1tidb + 3tikv shared

sysbench 测试

首先安装 sysbench:

1
brew install sysbench

之后进行配置,配置文件如下(可以通过执行 sysbench --helpsysbench {testname} --help 来查看通用配置与特定 test 的配置):

1
2
3
4
5
6
7
8
mysql-host=127.0.0.1
mysql-port=4000
mysql-user=root
mysql-password=
mysql-db=test
threads=8
report-interval=10
time=120

测试流程如下(主要测试的是查询性能,因此选用 lotp_point_select 测试):

1
2
3
4
5
6
7
8
# 先准备数据:8 张表,每张 10 万数据量
> sysbench --config-file=config.cfg oltp_point_select --tables=8 --table_size=100000 prepare

# 数据预热
> SELECT COUNT(pad) FROM sbtest{n} USE INDEX(k_{n});

# 执行测试
> sysbench --config-file=config.cfg oltp_point_select --tables=8 --table_size=100000 run

执行完成后,我们可以看到,8 张表,每张表 10 万条数据下的测试结果:

1
2
3
4
5
6
7
8
9
10
11
12
13
14
15
16
17
18
19
20
21
22
23
24
25
SQL statistics:
queries performed:
read: 108638
write: 0
other: 0
total: 108638
transactions: 108638 (905.23 per sec.)
queries: 108638 (905.23 per sec.)
ignored errors: 0 (0.00 per sec.)
reconnects: 0 (0.00 per sec.)

General statistics:
total time: 120.0093s
total number of events: 108638

Latency (ms):
min: 3.47
avg: 8.84
max: 79.62
95th percentile: 14.73
sum: 959867.21

Threads fairness:
events (avg/stddev): 13579.7500/48.15
execution time (avg/stddev): 119.9834/0.00

进一步增加测试线程,可以得到如下 thread 与 tps 的关系:

Threads TPS Avg. Latency 95% Latency
8 905.23 8.84 14.73
16 1115.55 14.34 24.83
32 1416.57 22.58 42.61
64 1637.44 39.06 75.82
96 1673.79 57.31 108.68
112 1706.90 65.58 125.52
126 1809.67 69.57 127.81

可以看到,从 64 线程开始基本达到了当前硬件环境下的吞吐量瓶颈点。

其他的监控类型:

go-ycsb 测试

安装 go-ycsh:

1
2
3
4
5
# 从 github 获取 go-ycsb
> git clone https://github.com/pingcap/go-ycsb.git

# build
> make

与原版 YCSB 略有不同,PingCAP 提供的 go-ycsb 不需要初始化表,选择 db 时也只需要指定 db 类型即可(如 mysql)。

配置基本参数:

1
2
3
4
5
6
## file name: basic.properties
mysql.host=127.0.0.1
mysql.port=4000
mysql.user=root
mysql.password=
mysql.db=test

workload 参数:

1
2
3
4
5
6
7
8
9
10
11
12
13
## file name: workload.properties
# 80 万数据
recordcount=800000
operationcount=30000
workload=core
readallfields=true

# 模拟读多写少的场景
readproportion=0.8
updateproportion=0.1
scanproportion=0
insertproportion=0.1
requestdistribution=uniform

执行测试:

1
2
3
4
5
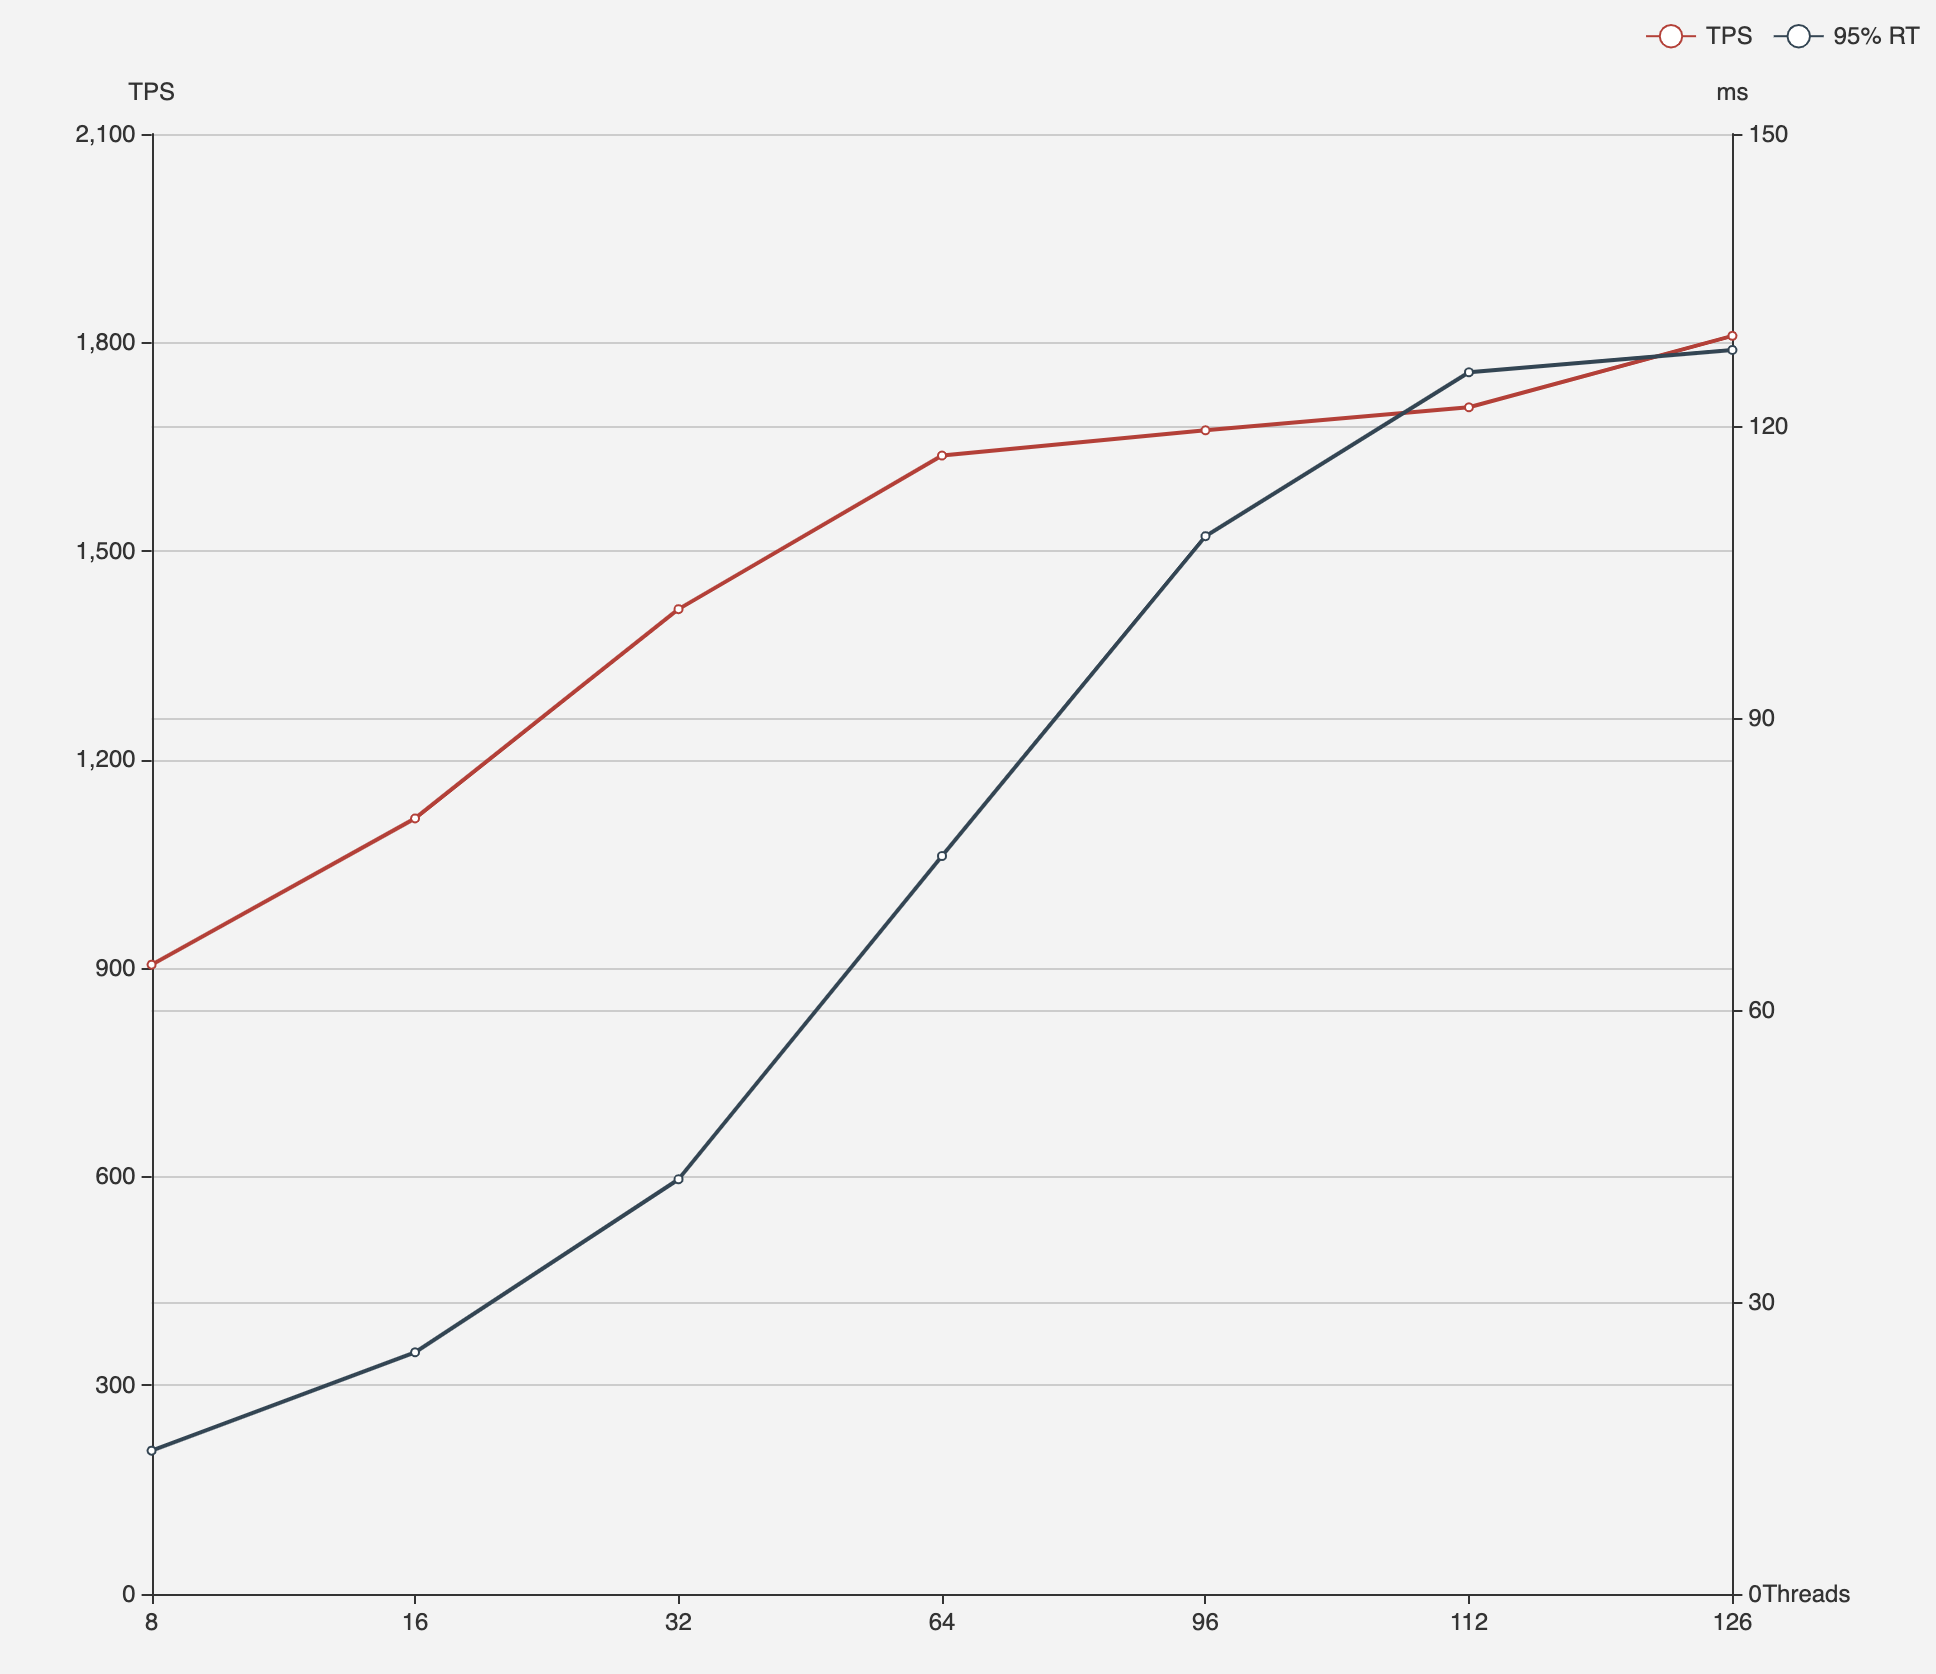
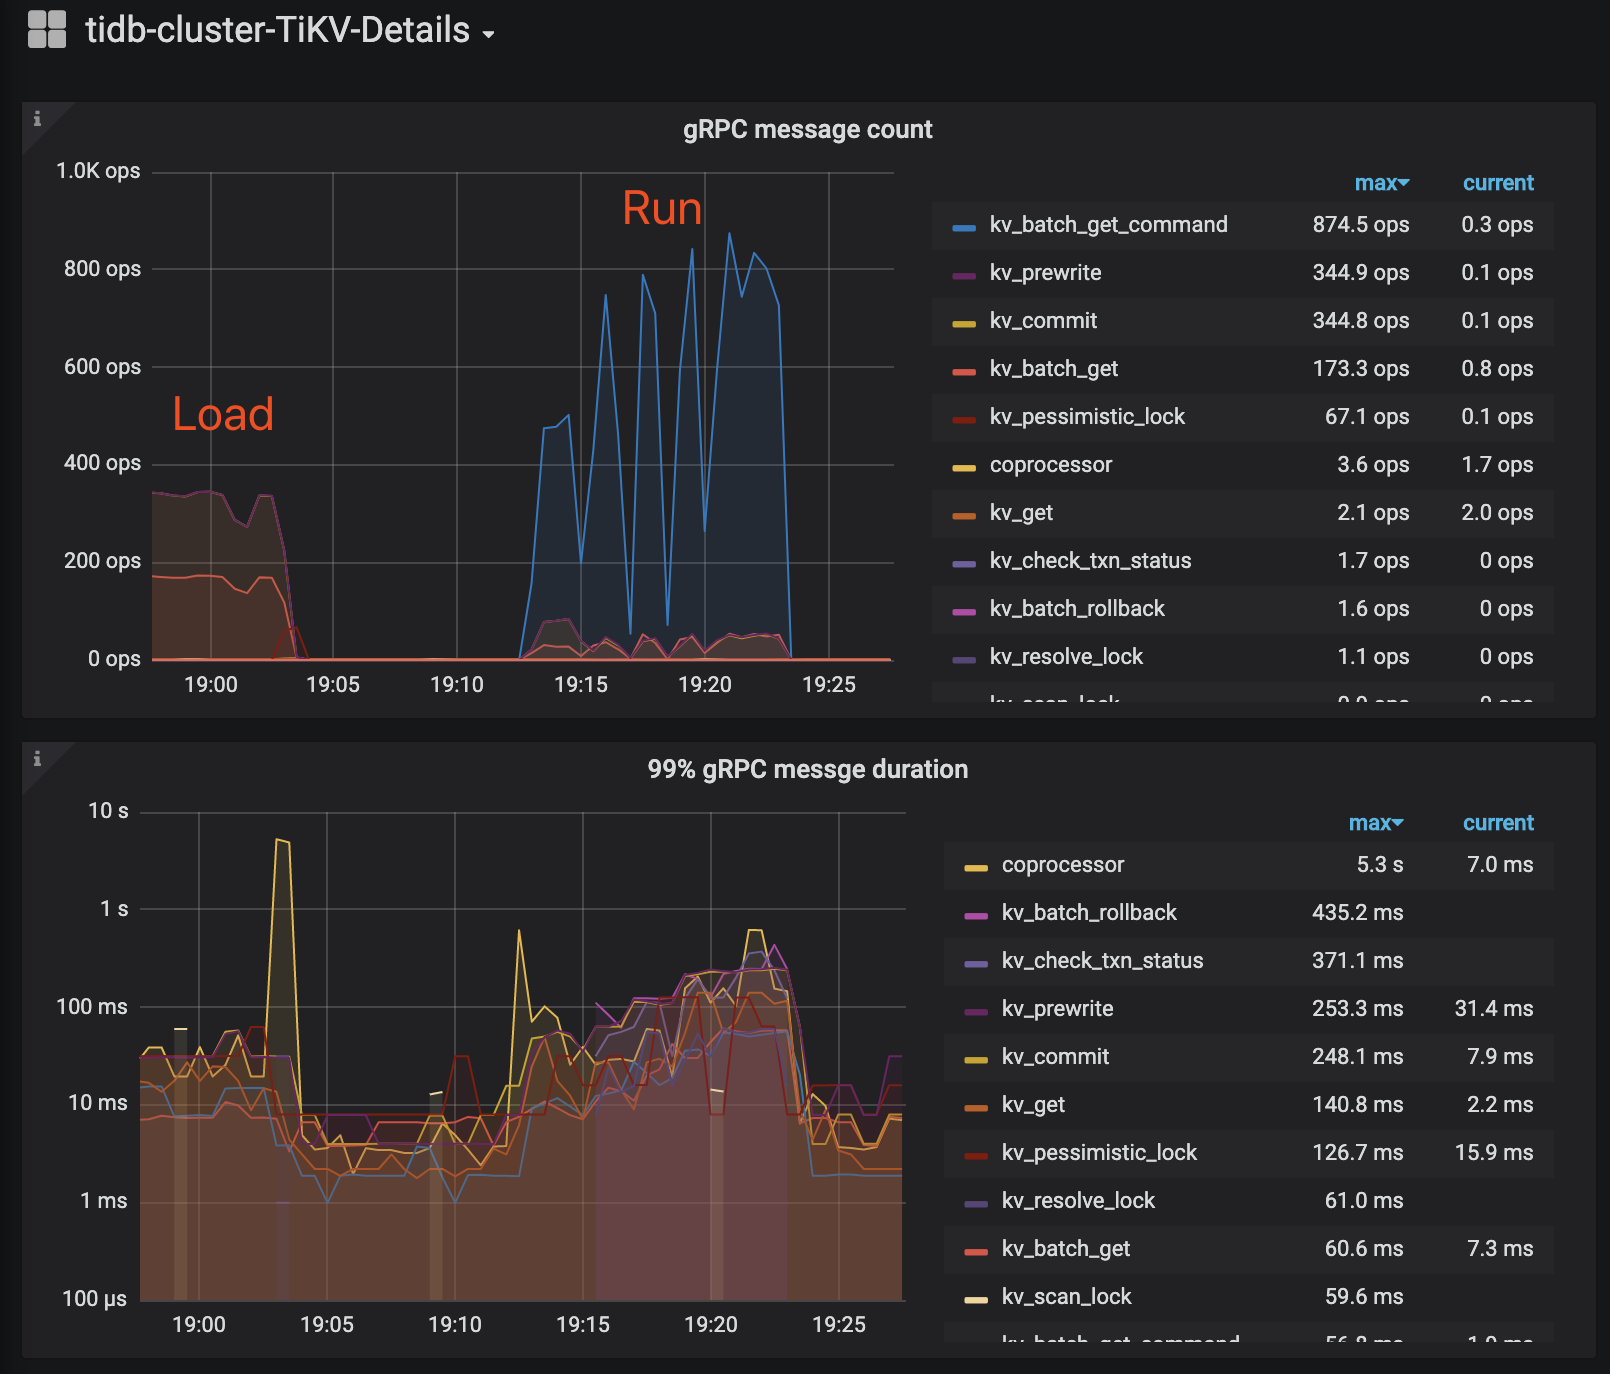
# load data
> ./bin/go-ycsb load mysql -P basic.properties -P runtime-config/workload.properties --thread=8

# run test
> ./bin/go-ycsb run mysql -P runtime-config/basic.properties -P runtime-config/workload.properties --threads=8

不断调整线程数,得到如下测试结果(主要展示 READ 数据,INSERT 和 UPDATE 结果并未列出):

Threads TPS Avg. Latency 99% Latency
8 232.5 20.575 60
16 374.3 28.982 75
32 485.0 44.81 105
64 474.3 91.362 237
96 544.8 121.888 295
112 530.4 144.853 341
128 547.6 159.132 401

显然,从 64 线程开始基本达到了当前硬件环境下的吞吐量瓶颈点。

其他的监控类型:

go-tpc 测试

安装 go-tpc:

1
2
3
4
5
# 从 github 获取 go-tpc
> git clone https://github.com/pingcap/go-tpc.git

# build
> make

由于 go-tpc 工具默认会以 root 用户连接 localhost:4000 因此无需更多配置,直接开始准备数据:

1
2
3
4
5
6
7
8
# 8 warehouse 8 partition
> ./bin/go-tpc tpcc --warehouses 8 --parts 8 prepare

# run without waiting time
> ./bin/go-tpc tpcc --warehouses 8 run --time 1m --threads 8

# run with wating time(keying & thinking time)
> ./bin/go-tpc tpcc --warehouses 8 run --wait --time 1m --threads 8
Threads tpmC tpmC with wait
8 600.7 6.8
16 602.1 18.0
32 736.5 31.8
64 844.6 65.3
96 817.3 83.7
112 819.0 100.8
128 774.5 106.0

显然,对于无等待的测试,从 64 线程开始基本达到了当前硬件环境下的吞吐量瓶颈点。

而对于有等待的测试,由于其 TPS 远没有达到无等待的水平,预示着整体 workload 较低,因此呈现随线程增长而线性增长的态势。

其他的监控类型:

性能瓶颈分析

sysbench 分析

从 sysbench 的测试情况来看:

  • 64 线程开始达到吞吐量瓶颈
  • 8 * 100000 的数据量下,TPS 能稳定达到 1k 以上。与此同时,tokv 的 CPU 使用率维持在 50% 以下,且三个实例的 CPU 使用率很平均,考虑应该是由于分了 8 张表的原因(而不是单表 800000 数据)
  • 从 64 线程开始逐步进入瓶颈后,直到 126 并发线程,其查询 95% RT 虽然翻了近一倍,但仍然只有 130ms 不到,反映出 sysbench 测试的纯查询特性,即没有产生明显的数据竞争现象。

ycsb 分析

从 ycsb 的测试情况来看:

  • 64 线程开始达到吞吐量瓶颈
  • 单表 800000 条数据,在 10% Insert + 10% Update 的情况下,Query 吞吐量最高在 550 左右,但结合 tikv 的 CPU 使用率低于 60%来看,应该是存在两种可能:
    • 单表且数据量较大,Region 的分配并不够平均(可以看到 tikv-2 实例的 CPU始终较低),导致查询时间上升
    • 存在一定数据竞争
  • 载入数据阶段的 Insert 操作 TPS 很低(200 左右),且 TiKV CPU占用接近 100%,分析可能是 raft 做数据同步所致

tpcc 分析

从 tpcc 的测试情况来看:

  • 64 线程开始达到吞吐量瓶颈(无等待场景)
  • 由于 8 个 warehouse 会产生一定的竞争,加之 tpcc 测试包含了更多的 DML 类订单操作,导致少量请求的 RT > 500ms,且 tikv 的 CPU 被打满
  • TPS 整体较低,与 tpmC 结合换算,能得知单个订单的处理过程中大致包含了 10 - 20 次各类数据库操作

总体分析

从上述三种不同类型的测试中,我们能够发现的一个明显共性即 TiDB 的吞吐量全部都在 64 线程上下开始触碰瓶颈。

分析这一点,我认瓶颈点应该主要在 tidb 组件:

  1. 在 sysbench 和 ycsb 的查询场景下,tikv CPU 基本都在 50% - 60% 附近,明显没有发挥其全部实力
  2. 由于硬件限制,tidb 只部署了单实例,因此在并发逐步升高后,tidb 达到了其性能瓶颈,试想若增加 1-2 个 tidb 实例,应该能够将 tikv 的 CPU 提升到 80%以上

另外,在 tpcc 中,由于大量的读写混合操作,导致事务处理的成本较高,因此占满了 tikv 的 CPU 容量,可见数据竞争是导致性能下降的重要因素。因此在 tpcc 中,性能瓶颈主要在 tikv 组件中,在优化上:

  1. 由于新版本的 TiDB 已经默认开启了悲观事务,结合具体业务,如果在数据竞争程度不高的前提下,改为乐观事务会提升性能
  2. 增加 tikv 实例,将数据分散至更多的 Region 中,以类似 “分段锁” 的方式降低锁粒度来改善性能。